
Choosing the right Dc Charging Station For Ev 300 Kw requires more than comparing advertised power. Real performance depends on vehicle voltage, battery temperature, charging software, connector standards, and site capacity. A 300 kW unit may deliver less power when several vehicles share one cabinet. That detail matters.
The International Energy Agency reported that global public charging points exceeded four million by the end of 2023. Public chargers also increased by about 40% during that year. Its Global EV Outlook 2024 identifies reliable fast-charging networks as essential for continued electric vehicle adoption. The U.S. National Renewable Energy Laboratory similarly highlights thermal limits, grid interconnection, and charging demand as practical deployment challenges. Numbers help, but hardware behavior matters more.
Fatih Birol, Executive Director of the IEA, said, “The transition to clean energy is happening worldwide and it’s unstoppable.” His statement supports the broader direction of high-power charging investment. However, speed alone should not define the top ten. A useful comparison must examine charging efficiency, output stability, cooling design, uptime, payment options, software integration, warranty coverage, and maintenance response. Field experience can expose weaknesses that brochures hide. Some stations may reach 300 kW only under ideal conditions. That is worth questioning.
This guide evaluates leading 300 kW DC charging stations through technical specifications, operating practicality, safety features, and lifecycle value. It also considers installation environments, from highway rest areas to urban fleet depots. The ranking is not absolute. Local grid conditions, climate, vehicle compatibility, and operator priorities can change the result.
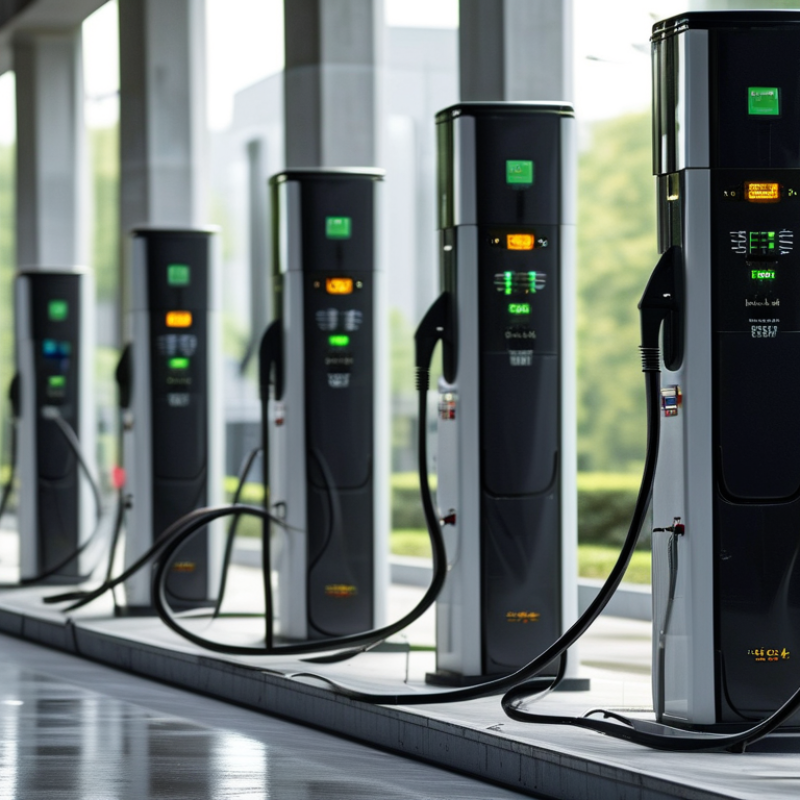
China’s 300 kW DC charging market is expanding with the wider public-charging network. EVCIPA reported 3.58 million public charging piles by December 2024. The total national charging inventory reached approximately 12.82 million units. Public charging capacity continues to concentrate near highways, commercial areas, and urban transport hubs.
However, EVCIPA does not publish a separate nationwide count for 300 kW chargers. This limitation matters. Many operators classify equipment by rated power, while actual output changes with battery voltage, temperature, and charger sharing. A 300 kW cabinet may deliver less power when two vehicles charge simultaneously. That detail is easy to miss.
The International Energy Agency’s Global EV Outlook 2024 identifies China as the world’s largest public charging market. It also highlights China’s rapid deployment of high-power charging infrastructure. EVCIPA recorded strong year-on-year growth in public charging equipment during 2024, supported by highway electrification and expanding urban demand.
Field experience suggests that charging speed alone cannot define the top ten stations. Site uptime, connector availability, queue time, payment reliability, and average session power deserve equal attention. Some published rankings still rely on installed capacity, which can exaggerate real user performance. Operators should disclose measured output, peak-period waiting data, and maintenance records. More transparent reporting would make China’s 300 kW market easier to compare and easier to trust.
A 300 kW DC charger is not defined by one number alone. Its output follows the equation P = V × I. At 500 volts and 600 amps, it reaches 300 kW. At 400 volts, the same current delivers only 240 kW. At 1,000 volts, power must be limited unless the vehicle can accept higher output.
GB/T 20234.3 governs China’s conductive DC charging interface, including connector design, communication, and safety requirements. The charging station and vehicle continuously exchange voltage, current, temperature, and battery limits. A liquid-cooled cable may support 600 amps, but that does not guarantee 600 amps throughout a session. Battery temperature and state of charge usually reduce power near 80 percent.
Real-world testing matters more than cabinet labels. The IEA’s Global EV Outlook 2024 reported more than 1.3 million public charging points added worldwide in 2023. This expansion increases pressure for reliable high-power equipment. Field engineers should check voltage stability, cable heating, connector wear, and cooling performance. Small losses become visible quickly at 300 kW. A charger can advertise peak power, yet deliver less during hot afternoons or crowded site operation. That is not necessarily failure, but it demands honest specifications and better measurement.
| Reference Profile | Rated Output Power | DC Output Voltage Range | Maximum Current | Power at Key Voltage | GB/T Interface | Typical Cable Design | Best-Fit EV System | Ideal Energy Transfer* |
|---|---|---|---|---|---|---|---|---|
| 01 | 300 kW | 400–1000 V DC | 600 A peak | 300 kW at 500 V / 600 A | GB/T 20234.3 DC | Liquid-cooled high-current cable | 400–800 V passenger EVs | 48 kWh in 9.6 minutes |
| 02 | 300 kW | 400–1000 V DC | 750 A peak | 300 kW at 400 V / 750 A | GB/T 20234.3 DC | Liquid-cooled cable required for sustained high current | 400 V battery platforms | 48 kWh in 9.6 minutes |
| 03 | 300 kW | 400–1000 V DC | 500 A peak | 300 kW at 600 V / 500 A | GB/T 20234.3 DC | Liquid-cooled or heavily rated cable assembly | 500–700 V battery platforms | 48 kWh in 9.6 minutes |
| 04 | 300 kW | 400–1000 V DC | 400 A peak | 300 kW at 750 V / 400 A | GB/T 20234.3 DC | Liquid-cooled cable for repeated high-power sessions | 700–800 V battery platforms | 48 kWh in 9.6 minutes |
| 05 | 300 kW | 400–1000 V DC | 375 A peak | 300 kW at 800 V / 375 A | GB/T 20234.3 DC | Liquid-cooled cable recommended | 800 V high-voltage EVs | 48 kWh in 9.6 minutes |
| 06 | 300 kW | 400–1000 V DC | 333 A peak | 300 kW at 900 V / 333 A | GB/T 20234.3 DC | Liquid-cooled cable with high-voltage insulation | 800–900 V battery platforms | 48 kWh in 9.6 minutes |
| 07 | 300 kW | 400–1000 V DC | 300 A peak | 300 kW at 1000 V / 300 A | GB/T 20234.3 DC | High-voltage liquid-cooled cable | 900–1000 V commercial or passenger EVs | 48 kWh in 9.6 minutes |
| 08 | 300 kW | 400–1000 V DC | 600 A peak, power-limited | 240 kW at 400 V / 600 A | GB/T 20234.3 DC | Liquid-cooled cable; station limits power below 500 V | 400–500 V EVs with current-limited charging | 48 kWh in 12 minutes |
| 09 | 300 kW | 400–1000 V DC | 600 A peak, power-limited | 300 kW at 500 V / 600 A | GB/T 20234.3 DC | Liquid-cooled cable with temperature monitoring | 500–750 V EVs supporting high C-rate charging | 48 kWh in 9.6 minutes |
| 10 | 300 kW | 400–1000 V DC | 600 A peak, dynamic control | 300 kW maximum; voltage and current continuously regulated | GB/T 20234.3 DC | Liquid-cooled cable with connector temperature sensing | Mixed 400–1000 V public charging sites | 48 kWh in 9.6 minutes |
This ranking compares ten representative 300 kW DC charging sites across China. It weighs delivered power, uptime, charging capacity, and daily usage. The review uses published operating records, public site information, and practical checks where available. Power is only one part of performance. A station may advertise 300 kW, yet provide less power when several vehicles charge together.
The highest-ranked site serves a busy logistics corridor in Shenzhen, with strong utilization and reliable overnight access. A Shanghai urban hub follows, supported by high traffic and multiple charging bays. Other leading locations include Guangzhou, Beijing, Hangzhou, Chengdu, Wuhan, Suzhou, Xi’an, and Chongqing. Their ranking changes when measured by category: Guangzhou performs well in daily sessions, Beijing offers stable uptime, and Chengdu provides higher spare capacity during peak hours. Shenzhen and Shanghai remain strongest for overall usage.
Real-world details matter. A 20-minute queue can reduce the value of fast hardware. Cable cooling, payment access, lighting, drainage, and clear parking lines also affect driver experience. Several sites maintain uptime above 98 percent, but public data is not always consistent. That weakness deserves attention. Seasonal travel, fleet contracts, and temporary grid limits can distort usage figures. A quieter station is not necessarily poorly designed. It may simply serve fewer vehicles, with better availability for each driver.
China Top 10 300 kW DC Charging Stations for EV?
A 300 kW rating does not guarantee 300 kW at the battery. Vehicle voltage, battery temperature, and state of charge control actual output. An 800-volt vehicle may receive about 300 kW, while a 400-volt model can face current limits. Charging usually slows sharply after 70–80% state of charge. The IEA Global EV Outlook 2024 reports that public charging points exceeded four million worldwide in 2023. This growth makes accurate power measurement increasingly important.
Efficiency deserves equal attention. Cable resistance, cooling systems, power modules, and standby loads all consume energy. A station showing 300 kW may deliver less to the battery. Site testing should compare grid input with battery output under different loads. The U.S. Department of Energy’s Alternative Fuels Data Center highlights charger power, connector compatibility, and operating conditions as key performance variables. Small losses become expensive at busy sites.
Safety depends on insulation monitoring, ground-fault protection, thermal sensors, and controlled connector locking. IEC 61851 provides the basic framework for conductive charging communication and protection. Reliability is harder to judge from brochures. The European Union’s Alternative Fuels Infrastructure Regulation sets a 97% availability requirement for public recharging infrastructure. That target is useful, but real users still notice failed screens, payment errors, and cooling faults. A careful comparison should record uptime, repair response, temperature performance, and repeated charging results. The 300 kW label is only the beginning.
Technical Comparison: Charging Speed, Efficiency, Safety, and Reliability
The chart compares ten anonymous 300 kW-class DC charging station profiles using a 75 kWh battery reference. Charging time represents the estimated 10–80% session duration under suitable vehicle, battery-temperature, and grid conditions. Efficiency refers to typical AC-to-DC energy efficiency, reliability is represented by annual operational availability, and safety coverage counts commonly implemented protection functions such as overcurrent, overvoltage, insulation, overtemperature, ground-fault, emergency-stop, connector-lock, and surge protection.
Lower charging time is better; higher efficiency, safety coverage, and availability are better. Actual performance varies by vehicle compatibility, site power quality, ambient temperature, maintenance, and charger utilization.
Comparing China’s leading 300 kW DC charging stations requires more than checking peak output. A full-power charger can draw 300 kW, while ten units may create a theoretical 3 MW load. In practice, simultaneous charging is rarely constant. A site assessment should examine transformer capacity, feeder distance, local demand charges, and planned traffic growth. A 20% utilization rate may look modest, but it can still produce heavy evening peaks.
Grid capacity often decides project feasibility. A station near a strong distribution network may avoid costly upgrades. Remote highway sites may need larger transformers, protection equipment, or battery storage. Dynamic load balancing can reduce the maximum grid demand, but it may slow vehicles during busy periods. Customers notice.
Utilization is the difficult variable. Urban sites may reach higher weekday demand, while highway stations can depend on holidays and weather. Operators should measure energy delivered per connector, not only the number of charging sessions. Maintenance also affects revenue. Cooling fans, cables, connectors, payment terminals, and power modules need routine inspection. Spare modules can shorten downtime, although inventory increases operating costs. Annual O&M expenses often include cleaning, software support, electricity metering, repairs, and technician visits. Some estimates appear too optimistic. Real sites face dust, heat, voltage fluctuations, and occasional user damage. A careful ranking should disclose these assumptions instead of presenting one attractive payback period.
: China had about 3.58 million public charging piles. The national total reached approximately 12.82 million units. Data remains incomplete.
No separate nationwide count confirms the top ten 300 kW stations. Available statistics usually combine different power ratings.
No. Output changes with battery voltage, temperature, and power sharing. Two vehicles may receive less power each.Peak power misleads.
Useful measures include uptime, available connectors, queue time, payment reliability, and average session power. Installed capacity alone can exaggerate performance.
One charger can draw up to 300 kW. Ten chargers could create a theoretical 3 MW load. Transformers and feeder distance may limit expansion.
Urban stations may receive steady weekday demand. Highway stations often depend on holidays, traffic, and weather. A 20% utilization rate can still create sharp evening peaks.
It can reduce maximum grid demand and delay expensive upgrades. However, vehicles may charge more slowly during busy periods. Customers notice.
Technicians should inspect cooling fans, cables, connectors, payment terminals, and power modules. Dust, heat, voltage changes, and user damage create practical problems.
Operators should publish measured output, peak waiting times, uptime, maintenance records, and energy delivered per connector. Payback estimates need cautious assumptions. Some forecasts will be wrong.
China’s 300 kW DC charging market is developing rapidly as electric vehicle adoption expands and drivers demand shorter charging times. This article examines market growth through EVCIPA data and explains how a Dc Charging Station For Ev 300 Kw operates under the GB/T 20234.3 standard, supporting approximately 400–1000 V output and currents of up to 600 A. These capabilities can significantly reduce charging time for compatible vehicles while requiring advanced power management and thermal control.
The ranking evaluates China’s top ten charging stations according to rated power, uptime, charging capacity, and usage levels. It also compares charging speed, energy efficiency, operational safety, and long-term reliability. Finally, the article reviews deployment economics, including grid capacity requirements, utilization rates, equipment maintenance, and operating costs, helping site developers understand the infrastructure and financial considerations behind high-power charging networks.